Data visualizations
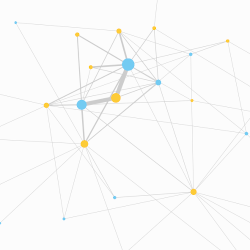
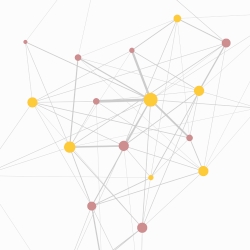
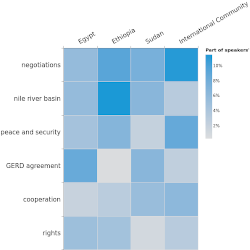
You can explore the visualizations that emerged from the GERD controversy mapping. The networks and heatmap represent interlinkages between different components of the controversy (speakers, conversations, concepts, tones), and the timeline captures the GERD process.